FlexiTable Worksheets
FlexiTable populates a worksheet with data harvested from a DGN model or DGN file. Each time you harvest data, FlexiTable creates a new worksheet. The worksheet name describes the data you have harvested. Here's the result of harvesting area features using FlexiTable …
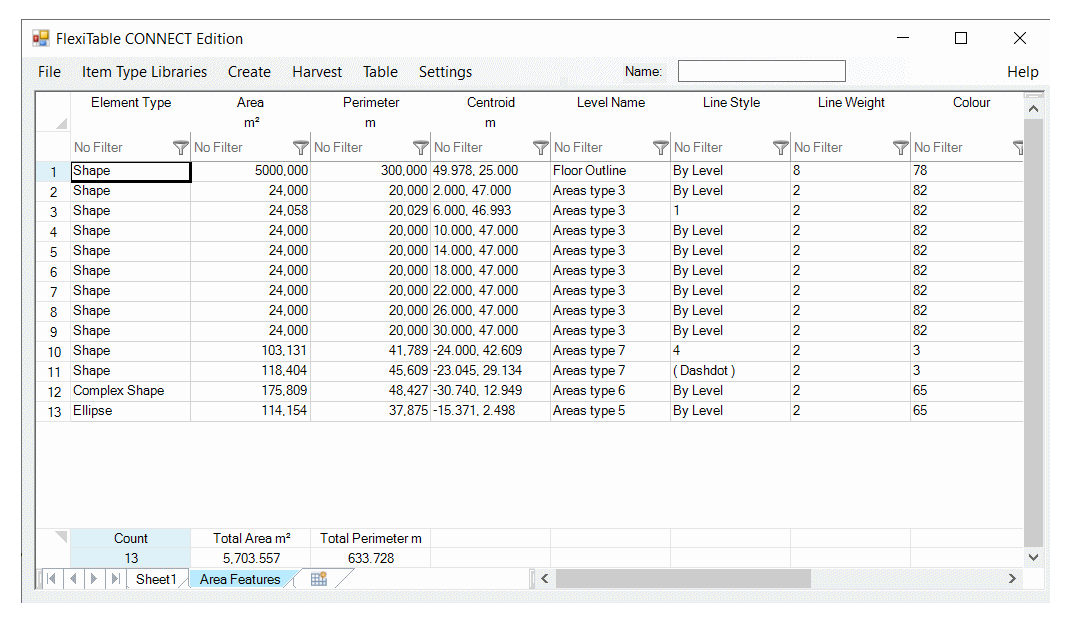
Worksheet Captions
Captions appear in the header of each worksheet, occupying usually the first two or three rows. Where the result of harvesting includes measurements, the units are shown in the bottom header row …
Worksheet Filters
When filters appear in the header of each worksheet, they occupy the last row, beneath the captions …
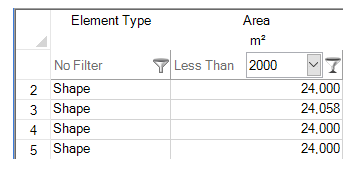
You can filter numbers or text, using several criteria. When you apply a criterion, the worksheet contents change. The footer count and aggregate values are recalculated to reflect the results of applying the filter.
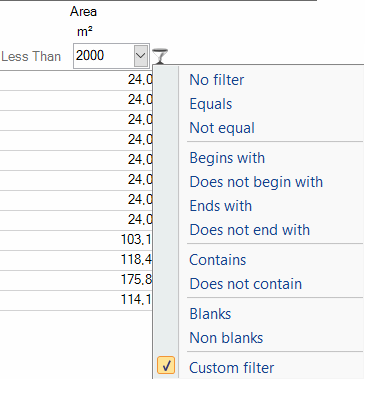
Create a filter by clicking on the filter icon (similar to a funnel). A menu opens where you can set filter parameters. FlexiTable supports both numeric and textual filtering.
Worksheet Footer
The footer of a worksheet is used to show arithmetic calculations, known as aggregates, on worksheet data.
Worksheet Aggregates
Aggregate calculations appear in the footer of each worksheet, occupying usually the last one or two rows. The aggregates include a count of the rows in the worksheet. The count will change to reflect the results of applying a filter …
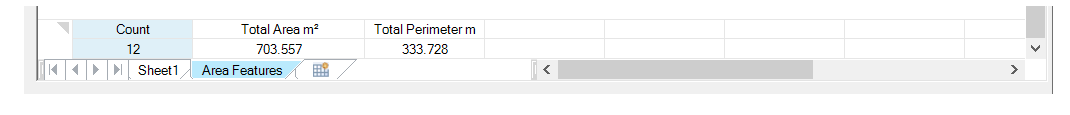
Whether other aggregates appear depends on the nature of the DGN data harvested. For example, if you harvest area features, then the worksheet includes the area and perimeter of each object. The total area and total perimeter are calculated and displayed in the worksheet footer. The aggregates will change to reflect the results of applying a filter.
Common DGN Data
When harvesting DGN data, each worksheet has columns that show …
- The name of the DGN file that contains the data
- The name of the DGN model that contains the data
When harvesting DGN elements, each worksheet has a column that shows …
- The element ID of the DGN element. An element ID is unique within the DGN file that contains it
If you right-click a cell in a worksheet, a context menu appears. You can choose to zoom to the element which supplies those data.
When harvesting DGN graphic elements, each worksheet has columns that show element symbology …
- The line colour
- The line style
- The line weight
Depending on the kind of data being harvested, other columns may be present.
