Introduction to MicroStation
MicroStation® is a 3D computer-aided-design (CAD) application for personal computers and workstations. MicroStation is produced by Bentley Systems, Inc.
MicroStation can be customised in various ways. This article shows how to plot algebraic functions as curves using MicroStation Visual Basic for Applications (MVBA).
Plotting Curves with MicroStation VBA
Questions similar to these, posed by MDL and VBA developers, appear on the Bentley Discussion Groups, typically the MicroStation Programming Forum.
Q How can I code MicroStation VBA to plot a curve or algebraic equation?
A
VBA offers a rich set of mathematical operators including trigononmetric (e.g. sin) and
exponential (e.g. exp) functions.
Its portfolio doesn't stretch to hyperbolic (e.g. sinh) functions,
although you can write your own as this
DevX article shows.
Nor does VBA offer any functions to handle
complex numbers.
The original question is about a Harmonograph, the curve traced by a decaying pendulum. Here's a sample equation that describes the motion of the pendulum on one axis …

Here's an example of a Harmonograph curve …

VBA Implementation
Here's the Harmonograph equation re-written to a form that is easy to translate to VBA …
x(t) = A1 . sin (t.f1 + p1).e^-d1.t + A2 . sin (t.f2 + p2).e^-d2.tHere's a VBA subroutine that implements that function. You don't need to copy this code — it's available in an MVBA project that you can download.
' ---------------------------------------------------------------------
'   DrawHarmonograph
' ---------------------------------------------------------------------
Private Sub DrawHarmonograph( _
		ByVal frequency As Double, _
		ByVal amplitude As Double, _
		ByVal decay As Double)
    Dim a1                                  As Double
    Dim a2                                  As Double

    Dim d1                                  As Double
    Dim d2                                  As Double

    Const p1                                As Double = 0#
    Const p2                                As Double = 0#

    Dim f1                                  As Double
    Dim f2                                  As Double

    a1 = amplitude
    a2 = amplitude

    d1 = decay
    d2 = decay

    f1 = frequency
    f2 = frequency

    Const Last                              As Integer = 100
    Dim points()                            As Point3d
    ReDim points(0 To Last) As Point3d
    Dim x As Double
    Dim t As Integer
    '	Compute points
    For t = 0 To Last
       points(t).x = t
       points(t).Y = a1 * Sin(t * f1 + p1) * Exp(-1 * d1 * t) + a2 * Sin(t * f2 + p2) * Exp(-1 * d2 * t)
       Debug.Print "x[" & CStr(points(t).Y) & "]=" & CStr(points(t).x)
    Next t
	'	Create a line-string from our point array
    Dim oLineString                         As LineElement
    Set oLineString = Application.CreateLineElement1(Nothing, points)
    ActiveModelReference.AddElement oLineString
End Sub
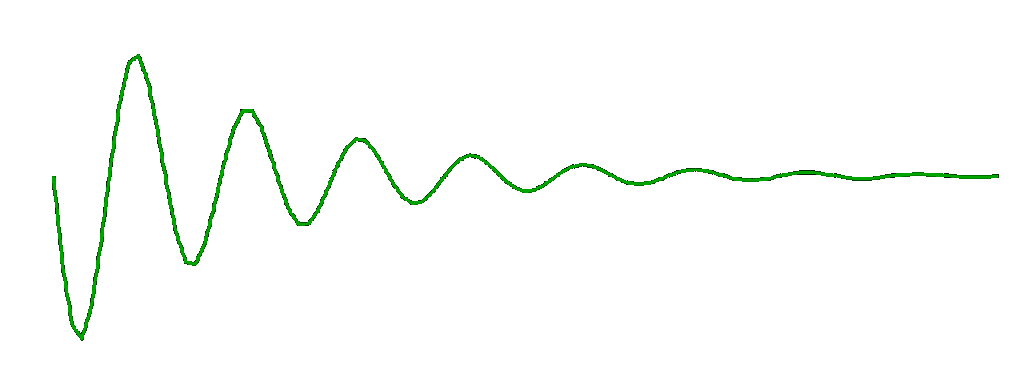
Here's the result of our VBA calculation …

Download VBA Harmonograph Project

The above code is available in this MicroStation
VBA project.
Unpack the ZIP archive and copy Harmonograph.mvba to a location where MicroStation
can find it.
A good place to copy it would be \Workspace\Standards\vba.
To create the graph, key the following into MicroStation's keyin dialog …
vba run [Harmonograph]modMain.Main