This article is about MicroStation® Visual Basic for Applications (VBA).
It's written for developers using
Bentley Systems MicroStation.
Questions similar to this appear on the
Be Communities Forums.
This problem appeared in the
MicroStation Programming Forum.
Introduction

The term Regression Analysis covers various types of numerical analysis. In the context of MicroStation, it concerns the analysis of point data, and how to represent those data with a best-fit line or curve.
MicroStation provides several development tools, of which the simplest and quickest is Visual Basic for Applications (VBA). VBA is a Rapid Application Development (RAD) tool, which Bentley Systems license from Microsoft. You can use VBA to write your own regression analysis tools.
Other options include C++, with the MicroStationAPI providing programming tools & examples. Third-party libraries, such as Boost math/statistics.
From MicroStation 2024 you can use Python to create MicroStation apps. The SciPy module provides pre-cooked linear regression.
Performance Considerations
If you have large numbers of points to analyse, then VBA may not be the best solution. While VBA is an excellent tool for prototyping a solution, it's not the best performing language when it comes to numerical analysis.
The fastest code is created using C++ to handle large and complex data structures, compiled to a native code executable or DLL. Native code runs fastest and makes best use of computer memory.
The Regression Analysis application is an example of a native-code application. It's optimised for regression analysis of a larger number of points than VBA can handle, and it works in both 2D and 3D.
Questions about Regression Analysis
These questions were posted to the Be Communities MicroStation Forum.
- How can I fit points to a straight line?
- How can I fit points to a circle?
Q How can I fit my survey points to a straight line in MicroStation?
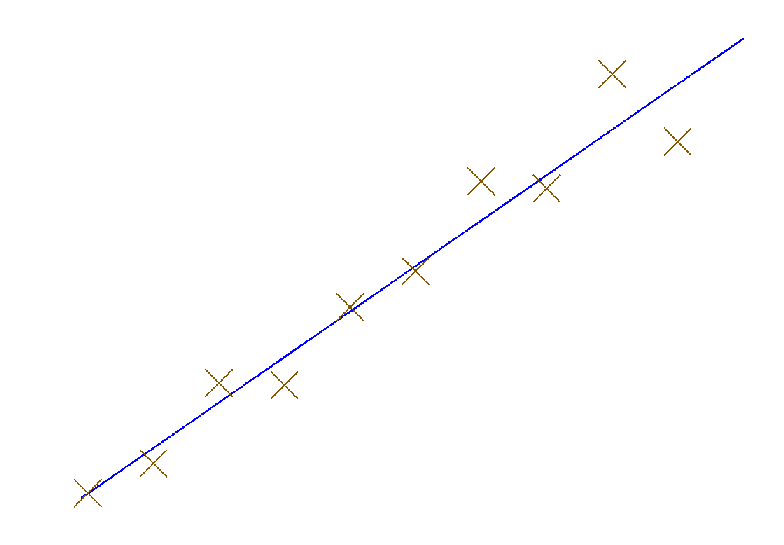
A MicroStation does not provide any regression analysis tools. However, some of the add-on applications may offer tools in that category for specific workflows. This example shows how to write code to perform a linear best-fit. You may have survey points that you want to use to create a best-fit line …

Least Squares Fit
The Least Squares algorithm calculates the coefficients of a linear equation that
passes through a set of points.
The form of the equation is
y = mx + b
where m and b are constants and x and y are variables.
Here's a subroutine that analyses an array of data points.
It uses a least-squares algorithm to calculate the linear coefficients
m and b.
With those constants available, it's trivial to create a line element to illustrate
the calculation.
Here's the code …
' ---------------------------------------------------------------------
'   LeastSquareAnalysis
'   Provides a solution to the equation Y = M * X + B
'   M = (n *Sxy - Sx * Sy) / (n * Sx2 - Sx * Sx)
'   b = (Sy - m * Sx) / n
'
'   Where:
'   n = number of points
'   Sx = the SUM of all the X coordinates
'   Sy = the SUM of all the Y coordinates
'   Sxy = the SUM of all (x * y)
'   Sx2 = the SUM of all (x * x)
'
' ---------------------------------------------------------------------
Public Function LeastSquareAnalysis( _
        ByRef m As Double, _
        ByRef b As Double, _
        ByRef data() As Point2d, _
        ByVal nPoints As Long) As Boolean

    LeastSquareAnalysis = False

    m = 0
    b = 0

    Dim sigma_x                             As Double
    Dim sigma_y                             As Double
    Dim sigma_xy                            As Double   ' SUM of all (x * y)
    Dim sigma_x2                            As Double   ' SUM of all (x * x)
    sigma_x = 0
    sigma_y = 0
    sigma_xy = 0
    sigma_x2 = 0

    Dim i                                   As Long
    For i = 1 To nPoints
        sigma_x = sigma_x + data(i).X
        sigma_y = sigma_y + data(i).Y
        sigma_xy = sigma_xy + data(i).X * data(i).Y
        sigma_x2 = sigma_x2 + data(i).X * data(i).X
    Next i

    m = (nPoints * sigma_xy - sigma_x * sigma_y) / (nPoints * sigma_x2 - sigma_x * sigma_x)
    b = (sigma_y - m * sigma_x) / nPoints

    LeastSquareAnalysis = True

End Function
VBA Project
We provide a VBA project that you can download. The project includes the above subroutine and a number of other procedures that …
- Prepare a dummy data set
- Plot the data set as points
- Analyse the data set
- Use the calculated coefficients of a linear equations to draw a line element
To execute the pre-prepared data set, use this key-in:
vba run [RegressionAnalysis]modMain.Main
Another MicroStation VBA enthusiast, Stefan Bernsdorf of
Centauron,
reacted to comments on the
MicroStation Programming Forum.
He added code to the VBA project to use a selection set of elements as the data source.
You can select a number of elements (ellipses, arcs, cells or zero-length lines), then use this key-in:
vba run [RegressionAnalysis]modMain.LeastSquareLineFromSelectedPoints
Q How can I fit my survey points to a circle in MicroStation?
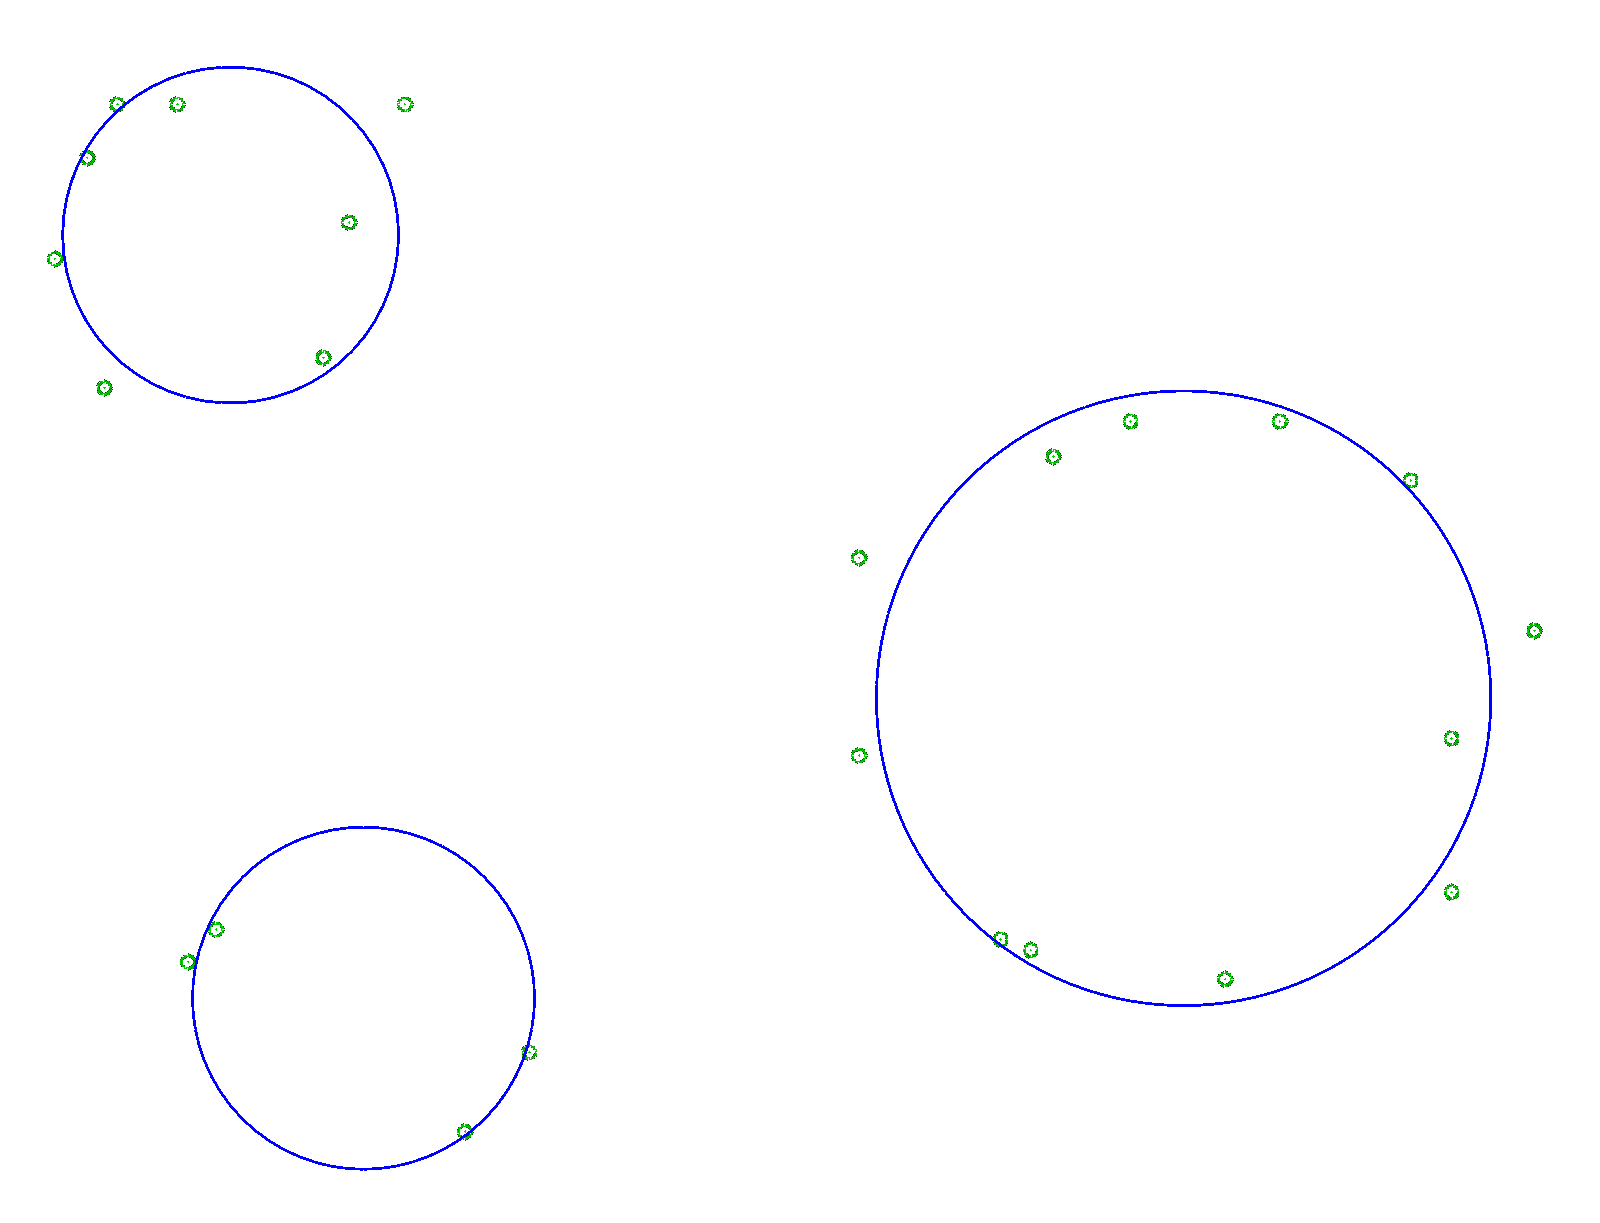
A MicroStation does not provide any regression analysis tools. However, some of the add-on applications may offer tools in that category for specific workflows. This example shows the result of a solution that creates a best-fit circle. You may have survey points that you want to use to create a best-fit circle …

Circular analysis is quite hard, and the VBA project does not attempt to solve it. However, the C++ Regression Analysis application can analyse both lines and circles, and furthermore works in both 2D and 3D. However, that app. is no longer available.
Regression Analysis C++ Application
Note: This code is untested with MicroStation CONNECT
LA Solutions has created a Regression Analysis application (plug-in) for MicroStation CONNECT to perform linear and circular regression analysis in 2D and 3D.
Download VBA Regression Analysis Project

The above code is available in this MicroStation
VBA project.
Unpack the ZIP archive and copy RegressionAnalysis.mvba to a location where MicroStation
can find it.
A good place to copy it would be \Workspace\Standards\vba.
To create the demonstration plot, key one of the following into MicroStation's keyin dialog …
vba run [RegressionAnalysis]modMain.Mainvba run [RegressionAnalysis]modMain.LeastSquareLineFromSelectedPointsBack to the VBA article index.